2002 THE BEGINNING OF THE DOLLAR BEAR MARKET AND 2003 DOLLAR EXTENDS DAMAGE, COMMODITY CURRENCIES SOAR
2002: THE BEGINNING OF THE DOLLAR BEAR MARKET
The year 2002 marked the end of the U.S. dollar’s seven-year cyclical ap-preciation from 1995 to 2001 and ushered in the beginning of a bear cy-cle, entering its seventh year as of this writing in 2008. U.S. manufactur-ers stepped up their complaints about an overvalued U.S. dollar eroding their competitiveness, demanding that President Bush impose tariffs on U.S. trading partners and declaring that the currency needed to depreciate by about 40 percent.
The president heeded those complaints, and U.S. Treasury officials be-gan adopting a policy of benign neglect, whereby they implicitly wanted the dollar to depreciate, despite mechanically reiterating declarations that a strong dollar is in the interests of the United States, a mantra widely adopted—and fully intended—under the second Clinton administration. The dollar ceiling was firmly reached in spring 2002 when President Bush launched a trade war, slapping foreign steel producers with tariffs in or-der to secure the Republican Party victory in key steel and manufacturing states ahead of the Congressional elections later that year. Trade actions, such as tariffs, always beget currency depreciations as countries aim at in-creasing the competitiveness of their products in the global marketplace.
As a result, selling the dollar across the board became the trade of choice, especially amid the successful conversion of the euro into an oblig-atory currency of exchange in the Eurozone in 2002. The swelling U.S. bud-get deficit was exacerbated by soaring war costs in Iraq, while the trade deficit soared due to rising oil imports and the relatively lackluster growth of exports. (See Figure 4.1.)
Meanwhile, commodity prices rebounded due to the falling value of the currency in which they were denominated, and partly due to a mod-est pickup in demand for energy and agriculture products. Metals, how-ever, did not share in the wealth as the world economic growth remained below its potential trend and financial markets extended their erosion from the heights of 1999–2000. Interestingly, of the eight currencies un-der examination, only the central banks of commodity-based economies— Australia, Canada, and New Zealand—raised their interest rates in 2002. (See Figure 4.2.)

FIGURE 4.1 U.S. dollar drops to bottom of currency returns in 2002.

FIGURE 4.2 Kiwi-related currency pairs dominated foreign exchange in 2002 as the greenback was sold across the board.
New Zealand Dollar: +97 percent
New Zealand’s dependence on agriculture exports was instrumental in the kiwi’s recovery, which was made possible by a 3.4 percent increase in general food prices following a rise of 2.5 percent and 0.2 percent in 2000 and 2001, respectively. Prices of agricultural raw materials moved from a 4.9 percent decline in 2001 to a 1.8 percent increase in 2002, surpassing the 1989–1998 average of −0.3 percent. These price developments helped sta-bilize the country’s swelling trade deficit, especially as neighboring Asian economies’ growth rate rebounded to 5.5 percent from 1.2 percent in 2002. New Zealand’s GDP growth soared from 2.7 percent in 2001 to 5.2 percent, exceeding the 1989–1998 average of 2.1 percent.
All of these developments pushed the Reserve Bank of New Zealand to make its first rate hike in two years, pushing up the overnight rate by 75 bps to 5.75 percent. Most notably, the kiwi’s 25 percent gain versus USD was a combination of the aforementioned NZD fundamentals and deteriorating USD dynamics that would trigger another 25 percent rally in 2003 and a 10 percent rally in 2004, totaling an impressive 60 percent gain in three years against the greenback. (See Figure 4.3.)
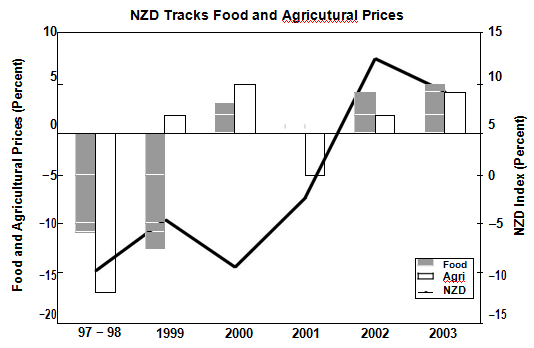
FIGURE 4.3 New Zealand dollar recovers from 1990s slump along with food and agricultural prices.
Swiss Franc: +55 percent
The strong performance of the Swiss franc was largely a reflection of a resurgence in European currencies exploiting the broad decline in the U.S. dollar, which set them off on a positive footing against other currencies such as AUD and CAD, whereby the former was dragged down by weak copper prices and the latter weighed down by the U.S. recession. Global portfolio managers also boosted European currencies as they increased their allocation in Western European markets at the expense of their U.S. counterpart. The CHF gained only 1.8 percent against EUR, while rising 15.8 percent and 8.7 percent against CAD and AUD. The CHF gained versus all of the currencies under examination with the exception of the kiwi. Al-though Swiss GDP growth more than halved to 0.4 percent in 2002, the CHF rally reflected a broad vote of confidence in European currencies (EUR, GBP, CHF), as these benefited from the solid Asian recovery.
Euro: +47 percent
Once it was evident that the Bush administration of 2002 wanted a weaker U.S. dollar—without necessarily having been explicit about it—currency traders sold the U.S. currency, with the euro acting as the primary bene-ficiary to the trend. The steel tariffs announced in March 2002 were also a green light to sell the dollar, as international trade actions are associ-ated with nations increasing the competitiveness of their products abroad. Also by spring 2002, the European Central Bank had successfully accom-plished its mission of ensuring that each of the 13 nations in the Eurozone made a smooth transition into making the euro the legal tender in all com-mercial and retail transactions in 2002. The ECB allayed public concerns of notes and coins shortages and worries about the spread of counterfeit currency.
In its third year of life, the euro had already cemented its role as the so-called anti-dollar, reacting to each and every dollar-specific development and benefiting from the downtrend in the greenback. Just as the euro suf-fered from the dollar’s solid performances in 2000–2001, it exploited the dollar’s woes quite thoroughly. The EUR-USD polarity was already seen in 1999–2000, but was magnified in 2001 and beyond, as the two currencies consistently moved in opposite directions. Figure 4.4 illustrates the persis-tently opposing directions between the two currencies, with the dollar’s outperformance in 1999, 2000, 2001, and 2005 being accompanied by neg-ative euro returns, while the euro’s outperformance in 2002, 2003, 2004, 2006, and 2007 was accompanied by negative dollar returns.
The main reason for the EUR-USD polarity is related to the growth of trading volumes in the EUR/USD pair. The creation of the euro meant that the EUR/USD pair eliminated trading in 11 individual cur-rency pairs against the dollar, one of which was U.S. dollar/deutsche mark (USD/DEM), which accounted for 22 percent of global foreign exchange
FIGURE 4.4 The diverging paths of the dollar and the euro reflect the increased duality between the two currencies.
turnover in 1995. In 2004, trading in the EUR/USD pair accounted for 28 percent of all transactions, compared to 17 percent and 14 percent for USD/JPY and GBP/USD. In 2007, the share slipped to 27 percent, but it remained clearly the top traded pair versus 13 percent and 12 percent for USD/JPY and GBP/USD.
The euro’s dominance in the U.S. Dollar Index, a futures instrument traded at the New York Board of Trade, also explains the polarity between the two currencies. The euro’s weight in the six-currency index is 57.6 percent, followed by the JPY, GBP, CAD, the Swedish krona (SEK), and CHF at 13.6 percent, 11.9 percent, 9.1 percent, 4.2 percent, and 3.6 percent respectively.
The other reason for the EUR/USD polarity is the euro’s potential to threaten the dollar’s role as the world’s reserve currency. In 1999, the euro’s share of global foreign exchange reserves stood at 25 percent versus over 70 percent for the U.S. dollar. In 2002, the euro’s share edged up to over 26 percent. Meanwhile, more central banks have already started diversifying their currency holdings, including more euros as a percentage of reserves at the expense of the U.S. dollar. Later in this chapter we consider how this relationship is maintained during both positive and negative phases for the two currencies.
British Pound: −4 percent
Sterling’s cumulative return against the seven major currencies was nega-tive due to losses against NZD, EUR, and CHF, but gains elsewhere were partially a result of those currencies’ losses against European currencies. The year 2002 was the only year when the Bank of England made no change in interest rates since the central bank gained independence in May 1997. It was also the only central bank besides the constrained Bank of Japan to hold rates unchanged in 2002. GDP growth rate slowed further, reaching 2.1 percent from 2.4 percent in 2001.
One noteworthy development weighing on GBP in late 2002 was that of geopolitics. As then British Prime Minister Tony Blair stepped up his support for a U.S.-led attack in Iraq, the UK position began to weigh on sterling as the market punished currencies whose nations were pursuing an increasingly isolated pro-war position. Aside from the economic costs of a prolonged involvement in the war, participating countries were at risk of reprisal and terrorist attacks on their own soil. In November 2002, the United Kingdom was the only G7 nation and permanent member of the UN Security council supporting the United States in drafting a UN resolution supporting war. Sterling’s tenuous position was exacerbated when Prime Minister Tony Blair faced heightened opposition by his own party and the majority of the British public.
Consequently, sterling’s trade-weighted index (basked against selected currencies) fell for seven consecutive months, between November 2002 and May 2003, the longest monthly losing streak since 1995.
Japanese Yen: −9 percent
The yen’s negative cumulative gains versus the seven other major curren-cies were largely a result of losses against the strengthening European cur-rencies (−6 percent and −8 percent versus EUR and CHF) as well as −13 percent versus the NZD. But the currency was unchanged against GBP as the latter staged broad declines in the fourth quarter due to geopolitical factors impacting the British pound. The yen’s 10 percent rally against the USD was largely a reflection of the dollar’s deterioration, considering inten-sifying deflationary pressures in Japan as consumer price growth dropped from −0.7 percent in 2001 to −0.9 percent in 2002.
Australian Dollar: −13 percent
The aussie gained only against the USD (10 percent) and CAD (9 percent) in 2002, the two currencies whose economies were interconnected via the sluggishness in the United States. Despite the rise in agricultural prices, which boosted the kiwi, copper prices returned a lackluster 2 percent gain, which was particularly negative for the aussie as the metal reversed most of the 16 percent gains sustained in first half of the year. The aussie’s negative reaction to the late developments in copper was similar to that in 2000 when copper prices fell 12 percent in the third quarter, following an earlier rally to 16-year highs. Rather than focusing solely on what copper did on the year, one must take note of the price developments during the latter part of the year (three to six months) for the impact on the currency aussie.
Canadian Dollar: −83 percent
Despite the 56 percent rise in oil prices and the Bank of Canada’s rate hikes to 3 percent, the Canadian dollar fell against each of the said currencies with the exception of the USD, against which it eked out a 1 percent gain. The Canadian dollar’s losses were primarily a result of eroding confidence based on the conclusion that Canada would be hardest hit from the U.S. re-cession. Indeed, exports fell 1.6 percent in 2002, dragging the trade surplus down 19 percent as exports to the United States accounted for 84 percent of the total. And although Canada voted against the Iraq war, once again its proximity to the potential war-related economic downdrafts from the United States was highly considered as a negative for the currency. Falling exports and a falling trade surplus dragged GDP growth from 2.5 percent in 2001 to 2.3 percent in 2002.
U.S. Dollar: −91 percent
The aforementioned shift of currency policy by the Bush administration toward that of a benign neglect (indirectly encouraging a dollar decline) as well as the imposition of trade tariffs on foreign steel producers was a green-light signal to sell the U.S. dollar regardless of fundamentals in other economies. The Fed cut rates by 50 bps to 1.25 percent, while the broad equity indexes tumbled to five-year lows on a combination of continued fallout from overvalued valuations in technology and escalating news of corporate malfeasances such as Enron, WorldCom, and Arthur Andersen.
2003: DOLLAR EXTENDS DAMAGE, COMMODITY CURRENCIES SOAR
The major differences distinguishing the global economic/market envi-ronment surrounding the 2003 dollar sell-off from that of 2002 were (1) the breadth of the commodity rally; (2) increased geopolitical uncertainty weighing on the U.S. dollar and U.S. assets after the outbreak of the Iraq war; and (3) deteriorating budget deficit and current account deficit bal-ances. Prolonged interest rate cuts by the Federal Reserve to a 45-year low of 1 percent also accelerated the dollar decline and boosted commodities as the Fed vowed to inject the liquidity to allay the risk of deflation. This readiness to debase the currency via aggressive rate cuts and injection of liquidity was likened to dropping money from helicopters, a metaphor that would earn its author, former Fed Board governor Ben Bernanke, the moniker “Helicopter Ben.” The Fed’s so-called reflationary monetary policy—boosting liquidity to lift inflation above zero—was a significant negative for the U.S. dollar and a windfall for commodities as investors fled the low-yielding currency for the high-growth commodities as these appreciated against their principal invoicing currency.
The September 2003 G7 meeting in Dubai proved a highly event-ful development for currency markets, when the seven most powerful economies urged China and Japan to refrain from intervening by maintain-ing their competitive currencies. The reaction to the unusual request was a rapid decline in USD/JPY, which is explored later in this section under JPY.
The three major commodity currencies—AUD, CAD, and NZD—were the top three performers on a cumulative return basis in 2003, return-ing their biggest gains versus the dollar at 34 percent, 18 percent, and 25 percent, respectively, hitting their highest levels against the greenback in a decade. (See Figure 4.5; their positioning in pairs trading is shown in Figure 4.6.) The rally in metals, foodstuffs, and agricultural raw materials was a boon for the three currencies, with the trend especially enforced by the deepening bear cycle in the dollar.

FIGURE 4.5 Commodity currencies dominate the foreign exchange market in 2003 with the aussie at the top.

FIGURE 4.6 AUD, NZD, and CAD occupy highest-performing FX pairs in 2003 due to broad rally in commodities.

FIGURE 4.7 Copper prices are instrumental in aussie price action.
Australian Dollar: +122 percent
Although Australia’s GDP growth slowed to 3.1 percent in 2003 from 4.1 percent in 2002, the aussie rallied aggressively as China, the world’s largest importer of copper, stepped up its demand, benefiting Australia, the world’s largest copper exporter. The resulting 45 percent increase in cop-per prices prompted currency traders to automatically bid up the aussie, lifting it against all seven other currencies, while taking advantage of the USD’s woes and dragging it down by 34 percent. (See Figure 4.7.) Ulti-mately, 2003 was a year with a rare triple boost for the Aussie:
Reserve Bank of Australia (RBA) hikes rates to two-year high. Fed cuts rates to 45-year lows.
Copper rallying to multiyear highs.
In trade-weighted terms, the aussie reached its highest since January 1989.
New Zealand Dollar: +63 percent
The price acceleration in agricultural raw materials and food items of 3.7 percent and 5.2 percent following 1.8 percent and 3.4 percent gains in 2002 provided considerable boost for the kiwi. The currency was hardly fazed by 50 bps of rate cuts in the spring, as they were followed by a quar-ter point hike, taking the overnight rate to 5.25 percent.
Canadian Dollar: +32 percent
Tracking the rise in oil and decline in the U.S. dollar, CAD posted its biggest percentage gain versus the U.S. currency, rallying 18 percent to 10-year highs. Oil rose 16 percent in the first nine weeks of 2003 and peaked out at a 13-year high of $38 per barrel just two weeks before the official start of the Iraq war on March 19. Once U.S. and British troops took Baghdad in April and President Bush announced “Mission accomplished” in early May, oil prices fell back to as low as $25 per barrel amid fading risk premium in the region. But the war was further complicated by sectarian violence and the murders of pro-U.S. Iraqi clerics, which catapulted oil back above the mid-$30s into the end of the year. Although prices closed 2003 barely $1 above where they had opened the year, all signals pointed to further price escalation, which boosted the oil-dependent Canadian dollar.
Euro: +28 percent
In its fifth year of life, the euro had its second consecutive rising as it in-creasingly assumed the role of the anti-dollar, exploiting the downtrend of the greenback. Just as the euro had suffered from the dollar’s solid perfor-mances in 2000–2001, it now exploited the dollar’s woes quite thoroughly. In December 2003, EUR/USD ended the year at $1.2590, closing well above the $1.1740 rate at which it had opened in 1999. The EUR-USD polarity had already been seen in 1999–2000, but was magnified in 2001 and beyond as traders adopted an increasingly negative stance toward the U.S. dollar. The converse also worked in 2005 when the dollar made a broad recovery, dragging the euro sharply lower.
In 2002, although Eurozone GDP growth slowed for the third consecu-tive year reaching 0.8 percent, growth rates made little difference as traders focused on selling the dollar on a combination of rising twin-budget and trade deficits, as well as 45-year low interest rates. Specifically, the euro appreciated 20 percent against the U.S. dollar, the highest annual increase it attained against the major seven currencies over the 1999–2007 period.
British Pound: −35 percent
The sterling’s woes in 2002–2003 were especially notable as the cur-rency decoupled from the euro, reflecting the extent of bearishness
toward the currency. Looking at the performances of 1999, 2000, 2001, 2005, and 2006, EUR and GBP showed similar magnitudes in their returns as these currencies were deemed economically interconnected. This was especially seen via their similar behavior against the U.S. dollar. But the relationship began to fade in the third quarter of 2002 when the United Kingdom increasingly supported the tenuous U.S. cause to invade Iraq. (See Figure 4.8.) Prime Minister Tony Blair drew heightened opposition from his own party and the majority of electorate. Aside from the issues of popularity and isolation, Britain subjected itself to the risk of terrorist attacks by groups staunchly opposed to the war. These risks were later substantiated during the London bombings of July 2005.
Aside from geopolitics, the economic reasons for the sterling’s 2003 downfall included an unexpected interest rate cut in February, followed by a subsequent cut in June to 3.75 percent. The renewed easing from the Bank of England punished GBP against major currencies, triggering a decline even against the ultralow-yielding CHF. Sterling’s trade-weighted index (basked against selected currencies) fell for seven consecutive months between November 2002 and May 2003, its longest monthly losing streak since 1995.

FIGURE 4.8 EUR breaks out of flat trend versus GBP in 2002–2003 as United Kingdom supports case for Iraq war.
Swiss Franc: −38 percent
A combination of ultralow interest rates, falling domestic growth, and weak external demand weighed on the Swiss currency against most major currencies with the exception of the struggling GBP and low-yielding JPY. Swiss GDP growth dipped to −0.2 percent in 2003 after slowing in the prior two years due to stalling demand from the sluggish Eurozone whose GDP growth hit 0.8 percent, down from 0.9 percent and 1.9 percent in 2002 and 2001 respectively.
PLEASE READ ALSO :
Seeking to prevent geopolitically driven safe-haven flows from boost-ing CHF excessively at a time when the world economy was already dragged by higher oil prices, the Swiss National Bank eased monetary pol-icy substantially. Interest rates fell to the low end of its 0.00–0.75 percent target range at a historically low 0.25 percent, driving away investors from the ultralow-yielding currency.
Japanese Yen: −44 percent
As Japan entered its sixth straight year of deflation, interest rates remained at virtually zero percent and currency traders found no interest in snap-ping up the low-yielding yen against the soaring commodity currencies and rallying European currencies. But the yen rallied as much as 10 percent against the U.S. dollar for the year in reaction to one of the key develop-ments dominating currency markets in 2003. At the September G7 meeting in Dubai, the top seven economies agreed on encouraging Asian economies to refrain from capping their currencies to gain competitive edge in the global market place. The message was directed at China and Japan, which were notorious for keeping their currencies artificially weak against the U.S. dollar. Once the communique´ was issued by the G7, USD/JPY tumbled from 117.70 to 113.50 within a week, losing 6 percent on the month to reach two-year lows.
U.S. Dollar: −127 percent
The year 2003 was the U.S. dollar’s worst year in terms of total returns against the seven other major currencies, losing a cumulative 127 per-cent against AUD, CAD, CHF, GBP, EUR, JPY, and NZD by 34 percent, 18 percent, 10 percent, 11 percent, 20 percent, 10 percent, and 25 percent, respectively. Increased geopolitical uncertainty, record high budget and trade deficits, and prolonged Fed rate cuts were all drivers of the green-back damage. Markets clearly understood that Washington’s currency pol-icy of benign neglect stemmed from its desire to see further decline in the dollar as long as it was orderly and did not erode general confidence in U.S.assets.
0 Response to "2002 THE BEGINNING OF THE DOLLAR BEAR MARKET AND 2003 DOLLAR EXTENDS DAMAGE, COMMODITY CURRENCIES SOAR"
Post a Comment