ANNUAL PERFORMANCE ANALYSIS OF INDIVIDUAL CURRENCIES AND 1999 RISK AVERSION, BOTTOM FISHING BOOSTS JAPANESE STOCKS AND THE YEN
The following sections show the highest- and lowest-performing currencies from 1999 to 2001, a period marked by general strength in the value of the U.S. dollar. In Chapter 4, we tackle currency performances from 2002 to 2007, a period involving the protracted decline in the dollar and the broad strengthening of the euro. The following currencies are examined in this analysis:
U.S. dollar (USD)
Euro (EUR)
Japanese yen (JPY)
British pound (GBP)
Swiss franc (CHF)
Canadian dollar (CAD),
also known as the loonie Australian dollar (AUD)
New Zealand dollar (NZD), also known as the kiwi
Currency returns are based on a yearly percentage return aggregating each currency’s bilateral returns against all other seven currencies. These performances are then measured against the backdrop of variables like world, regional, and national GDP growth, interest rates and central bank action, capital flows, current account balances, and commodities markets.
1999: RISK AVERSION, BOTTOM FISHING BOOSTS JAPANESE STOCKS AND THE YEN
The year 1999 witnessed the simultaneous recoveries of East Asian and Russian economies following the market crisis of 1997–1998, and the con-tinued boom into the equity markets of industrialized economies. Global fund managers exhibited a high degree of risk aversion from the emerging markets of Asia, Eastern Europe, and Latin America, opting to capitalize on higher growth in more developed economies. The Japanese yen was the highest-performing currency of 1999 as Japan offered the combination of industrialized economy status and cheap valuation, as the country was widely expected to finally recover from its decade-long economic slump. The “buy-the-Japanese-dip” strategy mobilized massive flows of funds into Japanese equities, propping up the yen across the board. While the intro-duction of the euro to currency trading replaced the national currencies of 11 European nations, U.S. equity markets were busy absorbing foreign flows chasing an increasingly solid bull market in high-growth technology stocks. (See Figure 3.1.)
The commodity currencies of Canada and Australia ranked second and third respectively in their rankings as the aussie benefited from high crop and copper prices and the loonie gained from a 134 percent increase in oil prices. Meanwhile, the euro found no other way but down after the cur-rency was inaugurated at an uncompetitive exchange rate against the dol-lar, yen, and pound, while devaluations of Asian currencies of 1997–1998 exacerbated Europe’s already lackluster exports foundation to the Far East. In its first year of trading, the euro registered what would become its worst performance out of the eight years that followed. But the euro was not the worst performer in 1999. The New Zealand dollar held that title due to a swelling trade deficit, falling dairy prices, and a slowing econ-omy. Figure 3.2 provides a summary of how the currencies fared against each other in trading pairs.

FIGURE 3.1 The Japanese yen was the biggest gainer amid major currencies in 1999, as world growth and equities recovered from the Asian crisis.
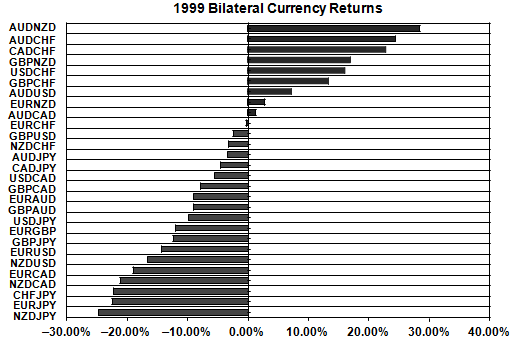
FIGURE 3.2 The 1999 returns of individual foreign exchange rates indicate the yen crosses were at the bottom of the rank, reflecting the yen’s broad strength.
Japanese Yen: +99 percent The Japanese yen’s 1999 performance was a resounding attack on conventional theories indicating that rising or high interest rates boosted currencies, while low or falling interest rates were negative for currencies. In 1999, Japanese short-term rates started the year at a postwar low of 0.25 percent—already the lowest among
Japanese Yen: +99 percent The Japanese yen’s 1999 performance was a resounding attack on conventional theories indicating that rising or high interest rates boosted currencies, while low or falling interest rates were negative for currencies. In 1999, Japanese short-term rates started the year at a postwar low of 0.25 percent—already the lowest among
FIGURE 3.3 With Japanese stocks at 12-year lows in October 1998 and down 66 percent from their peak of 1989, global fund managers rushed into cheap Japanese valuations, giving the yen its best performance in decades.
G7 economies—before being cut to 0.15 percent. Instead, the yen was boosted by a surge of global funds into Japanese stocks with the notion that Japanese markets were set to gain the most from the global recovery story, especially that Japan’s main equity index Nikkei-225 was drifting at 12-year lows in October 1998. The notion of cheap bargain stocks in the world’s second-largest economy during a global boom was the underlying theme to the yen recovery. Figure 3.3 shows how tumbling Japanese equi-ties reached 12-year lows in September 1998, prompting investors to seek bottom-fishing opportunities in Japanese stocks.
G7 economies—before being cut to 0.15 percent. Instead, the yen was boosted by a surge of global funds into Japanese stocks with the notion that Japanese markets were set to gain the most from the global recovery story, especially that Japan’s main equity index Nikkei-225 was drifting at 12-year lows in October 1998. The notion of cheap bargain stocks in the world’s second-largest economy during a global boom was the underlying theme to the yen recovery. Figure 3.3 shows how tumbling Japanese equi-ties reached 12-year lows in September 1998, prompting investors to seek bottom-fishing opportunities in Japanese stocks.

Figure 3.4 shows how net foreign purchases of Japanese stocks soared throughout 1999, producing a record total of 11.9 trillion yen for the year in net foreign purchases. These flows boosted the currency against the USD, EUR, and GBP by 10 percent, 23 percent, and 12 percent respectively for the year.
Australian Dollar: +76 percent The Australian dollar was the second-highest-performing currency in 1999, boosted by a 30 percent in-crease in copper prices as the world economy headed into recovery mode

FIGURE 3.4 Net foreign purchases of Japanese stocks soared to a record high in 1999, giving the yen its biggest rally in six years.
after the financial turmoil of 1997–1998. With minerals making up 50 per-cent of Australia’s total exports and copper accounting for 6 percent of mineral exports, the Australian dollar’s performance is closely correlated with the price of copper. As GDP growth in major industrialized economies rose to 3.5 percent in 1999 from 2.6 percent in 1998, the demand for copper was robust and so was demand for Australian exports.
Australia’s 4.4 percent GDP growth in 1999 was slower than the 5.3 percent rate of 1998, but higher than the average of the G7 economies. Surging demand from newly industrialized economies (Hong Kong, Korea, Singapore, and Taiwan) was also a boon for the aussie as these economies posted an impressive 7.5 percent recovery in GDP growth following the 2.5 percent contraction in 1998.
Canadian Dollar: +70 percent As was the case with the aussie ben-efiting from rising copper prices due to the global recovery of 1999, the Canadian dollar was boosted by higher oil prices resulting from growing world demand. In 1999, energy products made up 11 percent of Canada’s total exports, with crude oil accounting for 5 percent of exports. The 132 percent increase in the price of crude oil was an undisputable boon for CAD, lifting it by an aggregate 71 percent against the major seven
currencies. The loonie also gained more than 5 percent against the USD, its best performance versus the greenback since 1988.
Soaring oil exports lifted GDP growth to 5.5 percent from 4.1 percent in 1998, exceeding the 2.1 percent average growth of 1989–1998. Soaring global demand for Canada’s hottest commodity more than offset any neg-ative impact the currency would have otherwise sustained from the two interest rate cuts at the first half of the year.
U.S. Dollar: +27 percent The combination of strong growth in the industrialized world and fund managers’ risk aversion to nonindustrialized economies rendered the quality and safety of U.S. stocks a fundamental factor in going for U.S. markets, as was the case with Japan. Consequently, net foreign purchases of U.S. stocks soared to a record $107.5 billion in 1999, a 53 percent increase from the 1998 total.
From an interest rate perspective, surpassing the 4 percent handle for the third consecutive year, U.S. real GDP growth allowed the Federal Re-serve to raise interest rates by a total of 75 basis points (bps), taking back the rate cuts made during the 1998 market turmoil/liquidity crisis. U.S. in-terest rates were raised back to 5.5 percent, making them the highest in the G7 along with UK rates. In fact, it was the first time since 1984 that U.S. rates had matched their UK counterpart after 15 years of underperfor-mance. These factors helped the dollar gain an aggregate 27 percent return against the major seven currencies.
British Pound: +11 percent The British pound ended up gaining only against EUR (12 percent), CHF (13 percent), and NZD (17 percent) thanks to improved economic growth and a favorable interest rate envi-ronment as GDP growth remained at the 3 percent handle and the Bank of England raised rates by 50 bps. Continued erosion in EUR, lackluster growth in Switzerland, and a swelling trade deficit in New Zealand dragged these currencies down against GBP. But GBP lost ground against the JPY (-12 percent), AUD (-9 percent), CAD (-8 percent), and USD (-2 per-cent) due to equity flows, and commodity market developments prevailing in Japan, Australia, and the United States.
Euro: -74 percent The first year of the euro was its worst perfor-mance to date as the single currency began trading at $1.1740 in 1999, a rate that turned out to be unsustainably high for the fundamentals of the 11-nation Eurozone. Notably, the Asian flu of 1997–1998 did leave some damage on German exports, 11 percent of which went to the continent. German and French exports had continued to struggle, especially with 11 percent of German exports sold to Asia. Consequently, net exports’ con-tribution to German growth fell from 1.7 percent in 1997 to -0.4 percent
and -0.6 percent in 1998 and 1999. And although Eurozone GDP growth stood at 2.7 percent in 1999, growth rates in Germany and Italy were sub-par at 1.9 percent and 1.7 percent. Against the backdrop of sluggish growth, interest rates were at 3 percent, already deemed too high, especially as the late European Central Bank (ECB) president Duisenberg persisted in em-phasizing the upside risks to inflation at the expense of ignoring the ongo-ing downside risks to growth.
The euro was also saddled by heightened uncertainty related to the war in the former Yugoslavia, verbal clashes between Eurozone politicians, and the ECB regarding the need for the central bank to cut interest rates. Intense pressure on the ECB even caused speculation about the breakup of the Eurozone due to falling central bank credibility regarding monetary policy and inflated prices following the conversion from national curren-cies to the euro.
PLEASE READ ALSO : 2000 TIGHT FED, SOARING FOREIGN FLOWS BOOST THE GREENBACK TO 2001: RECESSION FAVORS DOLLAR DUE TO AGGRESSIVE FED CUTS
Swiss Franc: -95 percent The Swiss franc was the second-worst performer in 1999 amid the eight major currencies due to a combination of sluggish growth and cooling demand from the Eurozone. Swiss GDP growth more than halved in 1999 to 1.3 percent from 2.8 percent in 1998, falling below the 1.4 percent average of 1989–1998. Although Swiss rates were increased, they remained well below 2 percent, surpassing only their counterpart in Japan. Yet Switzerland lacked the size of Japan’s stock mar-ket capitalization, and thus was unable to absorb the magnitude of global capital flows that lifted Japanese stocks and the yen.
New Zealand Dollar: -114 percent With triple-digit losses, the kiwi was the worst performer in 1999 as slumping dairy prices dragged exports lower, exacerbating the swelling trade deficit. Over 50 percent of New Zealand’s exports came from agriculture, with dairy products accounting for 20 percent of total exports. Declining dairy prices led to a negative price growth and pushed up the trade deficit to 6.2 percent of GDP from 3.9 per-cent in 1998. Food prices fell 12.6 percent in 1999 following an 11 percent decline. The currency was also hit by falling poultry prices due to falling Russian demand following the Russian currency crisis of 1998.
0 Response to "ANNUAL PERFORMANCE ANALYSIS OF INDIVIDUAL CURRENCIES AND 1999 RISK AVERSION, BOTTOM FISHING BOOSTS JAPANESE STOCKS AND THE YEN"
Post a Comment