2004 Global Recovery Boosts Currencies Against Us Dollar And 2005 Commodities Soar Alongside Dollar, Carry Trades Emerge
For the second year in three years, the New Zealand dollar was the highest-performing currency of the eight major currencies in terms of cumulative returns, due to a favorable environment in monetary policy, global growth, and commodities (see Figure 4.9). In contrast, the U.S. dollar was the worst performer for the third consecutive year as the broadening global re-covery maintained bullishness in non-USD currencies. Swelling U.S. trade and budget deficits combined with a currency policy of benign neglect ac-celerated the declines. GDP growth in G7 nations rose to 3.1 percent in 2004, the highest growth rate since 1999. The emerging theme of central banks slowing their accumulation of U.S. dollar reserves in favor of eu-ros, sterling, and gold was taking hold and acted as a negative for the greenback.
Currencies in general delivered their strongest performance against gold since 1999 as central banks reached the end of their easing campaigns and shifted to tighter monetary policies. The end of the global interest rate–cutting cycle meant that projected increases in interest rates would challenge the returns on gold as an asset class. Both the Federal Reserve and the Bank of England began raising interest rates for the first time in
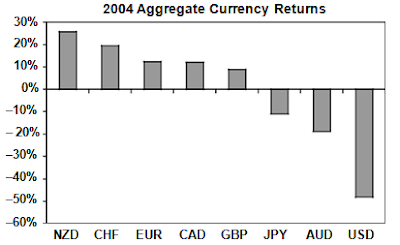
FIGURE 4.9 NZD regains top position in 2004 FX performance while USD remains at bottom of league.

FIGURE 4.10 USD and AUD pairs dominated the bottom of the rank as U.S. inter-est rates underperformed and Australia’s real estate slowdown hampered the aussie.
three years, while the European Central Bank held rates unchanged after cutting them in each of the previous three years. The Reserve Bank of Aus-tralia held interest rates unchanged for the first time since 1995, opting not to join the global tightening due to the broad decline in house prices following a decade-long housing bubble. Figure 4.10 shows the currency pairs trading results for 2004.
New Zealand Dollar: +26 percent
For the second year during this nine-year analysis period (1999–2007), the NZD was the highest-ranking currency in terms of cumulative re-turns. A combination of aggressive tightening from the Reserve Bank of New Zealand (RBNZ) and a favorable price environment in New Zealand’s top exporting commodities provided an attractive recipe to currency traders.
The RBNZ raised rates on five occasions, boosting the cash rate to 6.50 percent at a time when inflation rose to 2.3 percent from 1.7 percent and GDP growth recovered to 4.4 percent from 3.5 percent. As long as the growth and inflation arguments were in place for aggressive rate hikes,investors were willing to chase the higher-yielding kiwi as a carry-trade investment. Carry trades involve borrowing funds in low-yielding curren-cies such as JPY and CHF and investing the proceeds in higher-yielding currencies. Consequently, investors reap the benefit of the interest rate dif-ferential as well as the appreciation of the target currency. As we shall see in subsequent chapters, carry trades can involve investing not only in high-yielding currencies but also in high-growth assets such as appreciat-ing stock indexes, gold, and oil.
Rising commodities was another factor behind the soaring kiwi. Prices of nonfuel commodities rose 18.5 percent in 2004 after 6.9 percent and 1.7 percent in 2003 and 2002, respectively. Food prices rose 14.3 percent after 5.2 percent and 3.4 percent, while prices for agricultural raw mate-rials increased 5.5 percent from 3.7 percent and 1.8 percent. With over 50 percent of New Zealand’s exports coming out of the agriculture sec-tor, and with dairy products accounting for 20 percent of total exports, the continued price growth was a clear windfall for the nation’s GDP growth and currency. The currency was also boosted by the growth rebound in the newly industrialized Asian economies (NIAEs), attaining 2.4 percent GDP growth rate after 3.5 percent in 2003.
Swiss Franc: +19 percent
Though not spectacular, the cumulative returns of the Swiss franc were sufficient to place it in second position in the 2004 ranking due to a ro-bust export-led recovery following the 2003 recession. GDP growth rose to 2.5 percent from −0.2 percent, while growth in its major trading partners, the Eurozone and the United Kingdom, rose to 2.0 percent from 0.8 per-cent and to 3.3 percent from 2.8 percent. Battling the risk of deflation, the Swiss National Bank held rates unchanged, which increased demand for currency deemed to have been undervalued, relative to the nation’s GDP growth rate.
Euro: +12 percent
Although its returns were well below those of the strong cumulative gains of 47 percent and 28 percent in 2002 and 2003, the euro managed to rank third-best performer in 2004 with a 12 percent cumulative gain versus the other seven major currencies. Gaining from a jump in GDP growth to 2.0 percent from 0.8 percent in 2003, and from the absence of ECB pol-icy tightening, the euro accumulated a strong boost of confidence in its sixth year of operation. Bank of France president Jean-Claude Trichet’s assumption of the ECB presidency in November 2003 added a vital vote of confidence to the young central bank due to his proven record as a credible and highly respected central banker in the Eurozone’s second-largest econ-omy. Trichet also became the single dominant voice of the euro, unlike in the early years when several policy makers tended to give misleading and inconsistent signals.
Most notably, the euro’s robust performance was a reflection of the dollar’s woes as the U.S. currency was saddled with further swelling in the twin deficits (budget and trade) resulting from lower taxes, surging war spending, and rising energy imports. EUR maintained its role of the anti-dollar in global currency markets as the EUR/USD pair accounted for 28 percent of all transactions, compared to 17 percent and 14 percent for the USD/JPY and GBP/USD pairs. The euro breached above the $1.30 mark for the first time in history, delivering a resounding signal of confidence to currency traders and global asset managers.
Canadian Dollar: +12 percent
The loonie fully exploited the 34 percent rise in oil prices, which at one time during the year were up 72 percent, the highest since Iraq’s 1990 inva-sion of Kuwait. Exports rose 7.5 percent in 2004 after declining 1.4 percent and 1.6 percent in 2002 and 2003 respectively. The role of rising oil prices was highlighted in the fact that energy exports accounted for 16 percent of total exports in 2004, following 15 percent and 12 percent in the prior two years. Crude oil exports rose 24 percent, more than doubling the growth of 2003. Benefiting from the impact of higher oil and a sharp recovery in GDP growth to four-year highs at 3.7 percent, the loonie surged 7 percent against the U.S. dollar to 12-year highs, following an 18 percent increase in 2003. Those returns placed the CAD on the radar screen of asset man-agers seeking returns from a nation with budget and trade surpluses—the antithesis of the U.S. economy.
British Pound: +9 percent
The sterling’s 2004 performance came under pressure mainly in the sec-ond half of the year when house price growth slowed sharply, risking a standstill in the highly leveraged household spending sector. The Bank of England’s five rate hikes between November 2003 and August 2004 had started to take effect in summer 2004. In August, the Halifax measure of house prices fell by 0.6 percent, posting its 10th monthly decline in the preceding five years, a period when home prices had more than doubled. Nationwide’s housing price data showed growth of only 0.2 percent and 0.1 percent in September and August respectively, rates not seen since summer 2000. (See Figure 4.11.)

FIGURE 4.11 Slowing growth in UK home prices weighed on the British pound’s trade-weighted index.
In addition to the housing slowdown, central bank policy makers had begun signaling the peak in interest rates, thus accelerating the declines in the currency.
Japanese Yen: −11 percent
The losses in the Japanese yen against individual currencies were mostly moderate, ranging from 1 to 4 percent, with the exception of the NZD and USD against which it fell 5 percent. The decline against the NZD was based on surging carry trade, whereby investors funded investments in low-yielding JPY (0.15 percent interest rate) to deposit the proceeds in higher-yielding NZD (over 6 percent interest rate).
So why did the JPY fall by the same amount against the USD when U.S. interest rates stood at the relatively low levels of 1.0 percent? The main rea-son was persistent currency interventions by the Bank of Japan, whereby it sold its own currency in the open market to buy U.S. dollars in order to prevent the yen from appreciating markedly and weighing on Japanese exports. A lower yen also helped Japan fight its deflation problem as nega-tive price growth entered its sixth consecutive year. Oftentimes, Japanese officials succeeded in steering the yen lower simply by jawboning the market—in other words, threatening to intervene or expressing concern with rapid currency appreciation. Unlike the 2003 interventions, which were carried out almost every month, the yen-selling interventions of 2004 lasted only the first four months of the year, albeit on a greater scale.
Australian Dollar: −19 percent
The main reason for the aussie’s 2004 underperformance was the accel-erating decline in home prices, threatening to halt the nation’s longest economic expansion. Despite a 46 percent increase in copper prices and an increase in GDP growth from 3.7 percent in 2003 to 3.1 percent, many home buyers were forced to let their properties go into foreclosure, thereby im-pacting consumer expenditure.
Australia’s house price boom began in the mid-1990s, and gathered speed after the 2000 Olympics with a 20 percent annual increase in some cities. The peak was reached in mid-2003. As house price growth slowed markedly, inflation fell from 2.8 percent to 2.3 percent, the lowest since 1999. The interest rate hikes of November and December 2003 helped ac-celerate the slowdown into the first half of 2004, and caused the central bank to refrain from raising rates for the first time since 1999, when the economy struggled following the 1997–1998 Asian crisis.
Although rates were held at 5.25 percent throughout the year, specula-tion of an RBA rate cut was behind the aussie’s declines. But the economy was spared the threat of recession thanks to the price surge in Australia’s minerals, powered by China’s growing demand for commodities.
U.S. Dollar: −48 percent
Despite 10 rate hikes of 25 bps each by the Federal Reserve, the U.S. dollar ended at the bottom of the performance rank for the third straight year in 2004. The widening budget deficit hit a record $412.55 billion in fiscal 2004 following a record $377.14 billion in fiscal 2003. The fiscal profligacy of the Bush administration and its negative impact on market sentiment was largely the cause of the renewed attack on the currency after his reelection in the 2004 elections. The decision to extend the first term’s income tax and dividend tax cuts has also eroded any hopes of stabilizing the fiscal imbalance. The U.S. trade gap hit a record 5.7 percent of GDP as soaring oil exacerbated the rise in oil imports. Despite the 30 percent drop in the dollar’s trade-weighted value since January 2002, the U.S. trade gap had risen by over 80 percent.
The falling dollar also reduced foreign investors’ interest in U.S. as-sets to the extent of curtailing the inflows required to finance the swelling deficit. The currency policy of benign neglect also hurt the greenback. Trea-sury Secretary John Snow’s insistence that the dollar’s value must be “de-cided by the markets,” at a time when traders had shaved 30 percent off the currency’s value in trade-weighted terms since January 2002, left markets no choice but to conclude that the U.S. administration was encouraging a weaker dollar. It wasn’t until 2005 that prolonged Fed tightening would begin helping the U.S. currency.
2005: COMMODITIES SOAR ALONGSIDE DOLLAR, CARRY TRADES EMERGE
The widely held notion stating that commodity prices are inversely related to the U.S. dollar was largely debunked in 2005 as the greenback rallied along with oil, gold, and most other primary commodity prices. There were several reasons for these developments:
Continued Fed rate hikes into 2005 lifted U.S. rates back above their Canadian, Eurozone, and UK counterparts, offering USD holders a more favorable interest rate differential.
Repatriation of foreign-based earnings by U.S. multinationals to take advantage of a provisional tax had increased USD-bound flows.
Soaring demand for commodities was amplified by China’s advance as the world’s top consumer of most agricultural and metal products.
Robust growth rates in G10 nations complemented China’s demand.
Figure 4.12 shows the U.S. dollar was the second-highest-performing currency in aggregate terms, standing among the three major commodity currencies (CAD, NZD, and AUD).
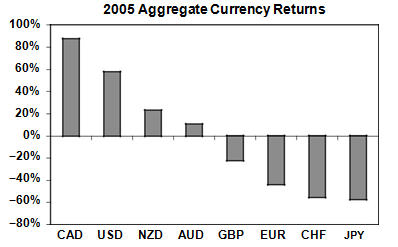
FIGURE 4.12 The U.S. dollar joined commodity currencies among top-performing currencies of 2005 as the Fed tightened and world commodities rallied.
This was also the year of carry trades as global investors benefited from diverging monetary policies between the low interest rate currencies of Japan and Switzerland, and higher interest rate currencies of the United States, Canada, Australia, and New Zealand. Investors particularly sought currencies with the greatest potential for appreciation and rising interest rates. As these flows were mobilized, the higher-yielding currencies out-performed, while lower-yielding currencies headed down across the board (see Figure 4.13).
Canadian Dollar: +88 percent
The Canadian dollar attained a cumulative 88 percent increase against the seven major currencies in 2005, its highest return during 1999. A 41 percent increase in oil prices boosted Canada’s oil exports to a 19 percent share of total exports in 2005, from a 16 percent and 15 percent share in the prior two years, providing the overall economy and the currency with signifi-cant windfall. The combination of an external-led expansion and strong domestic demand fed into rising inflation, which reached 2.2 percent from 1.8 percent, driving the Bank of Canada to raise rates by 75 bps to a two-year high of 3.25 percent.
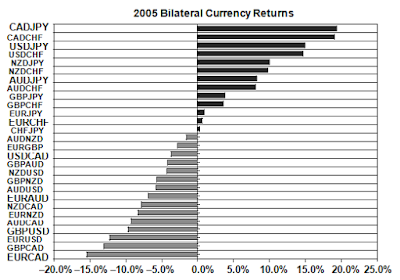
FIGURE 4.13 The Canadian dollar prevailed throughout the top-performing cur-rency pairs of 2005.
Although Canadian interest rates were lower than in the United States, United Kingdom, Australia, and New Zealand, the CAD delivered the better performance against those currencies due to its benefiting from rising oil. The currency rose from 12-year highs against the U.S. dollar in 2004 to 15-year highs in 2005. It also delivered solid gains versus CHF, JPY, EUR, and GBP at 19 percent, 19 percent, 15 percent, and 13 percent respectively.
U.S. Dollar: +58 percent
After a three-year slump at the bottom ranking of cumulative returns, the U.S. dollar staged a broad comeback in 2005 due to a steady dose of in-terest rate hikes, USD-bound capital flows, and political uncertainty in the Eurozone. After slashing rates to a 45-year low at 1 percent in 2003, the Federal Reserve began a gradual policy of normalizing monetary policy in 2004 and 2005, with five and eight 25 bps rate hikes respectively, taking the Fed funds rate to 4.25 percent by the end of 2005. The incremental tightening served to contain inflationary pressures without hampering the economic recovery from the 2000–2001 recession as the Bush $212 billion tax stimulus worked its way through the economy. U.S. interest rates rose back above their Eurozone counterparts, extending the yield differential to 225 bps, while cutting their yield disadvantage relative to rates in the United Kingdom.
The dollar also benefited from the Homeland Investment Act, which was part of the American Jobs Creation Act of 2004, signed into law by President Bush, allowing U.S. companies to repatriate earnings perma-nently reinvested abroad. Funds were taxed at 5.25 percent, rather than the normal tax rate of 35 percent, prompting companies to bring back an estimated total of $180 to $210 billion.
Political uncertainty in the Eurozone emerging from France’s rejection of a European Union referendum spelled trouble for political union ambi-tions and dragged an already retreating euro farther down.
New Zealand Dollar: +23 percent
The kiwi maintained its strong positive correlation with rising food and agricultural raw materials, while gaining from a rising interest rate environ-ment as the central bank tightened rates by 75 bps to 7.25 percent. As cen-tral banks raised rates in concert, investors sought added returns in growth and yield, which was on offer by the kiwi. Although GDP growth in NIAEs slowed from 5.9 percent to 4.7 percent, demand for kiwi was largely driven by carry-trade investors, especially as Japanese and Swiss interest rates offered attractive funding means for such trades. Offering the highest in-terest rates among the eight currencies, the kiwi was a popular destination for carry trades, appreciating 10 percent against JPY and CHF. At some point in January, the kiwi soared to a 14-year high against the U.S. dollar before the Fed rate hikes triggered a broad run-up in the greenback.
Australian Dollar: +11 percent
The aussie managed to stand out as a net gainer in 2005 as the Australian economy struggled to recover from the housing correction. Although GDP growth had slowed from 3.7 percent in 2004 to 2.8 percent in 2005, the aussie benefited from a 76 percent increase in copper prices as China stepped up its consumption of minerals and commodities with the help of its appreciating currency. And despite slowing GDP growth in Australia and the NIAEs, the bulk of the aussie’s gains were a result of broadening carry trades as the RBA raised rates to 5.50 percent. The central bank kept the door open for further tightening as inflation rose to 2.7 percent from 2.3 percent.
British Pound: −22 percent
The sterling’s declines were largely a result of fears that the 10-year-old housing bubble was finally about to burst. The slowdown of 2004 grew more pronounced in 2005, and annual home price growth hit its lowest in nine years, while month-to-month rates were showing declines. The ster-ling’s losses were magnified by the fact that the Bank of England was the only central bank among those analyzed to have cut interest rates, which proved to be a punishing outcome in a year when FX speculative flows thrived on carry trades. Sterling’s worst performances were against the CAD and USD and −13 percent and −10 percent respectively.
Euro: −44 percent
The euro sustained its first decline in three years as a result of weak Eu-rozone growth, political uncertainty, and the euro-dollar duality obtaining the best of the single currency. Eurozone France’s rejection of a proposed European Union Constitution dealt a blow to confidence in the European Union and the future of its currency, especially with France being the second-largest economy of the Eurozone. The rejection raised questions about the political unity of the Eurozone, adding to speculation that some member-nations would exit the currency area and trigger a crisis of con-fidence in the seven-year-old currency. The slowdown in Eurozone GDP growth to 1.5 percent from 2.0 percent as well as that in the United King-dom and Switzerland also weighed on the region’s net external trade.
The euro-dollar polarity was once again in play, as gains in one cur-rency shed losses in the other. The euro’s dominance in the U.S. Dollar Index caused the polarity between the two currencies. The euro’s weight in the six-currency index is 57.6 percent, followed by the JPY, GBP, CAD, SEK, and CHF at 13.6 percent, 11.9 percent, 9.1 percent, 4.2 percent, and 3.6 percent respectively. As the dollar rallied strongly against most curren-cies, the euro took the short end of the stick.
Swiss Franc: −55 percent
The low-yielding CHF was hit across the board as 2005 marked an esca-lation of carry trades, with investors showing risk appetite in leveraging their trades in high-yielding assets by borrowing in lower interest rate CHF and JPY. The Swiss franc’s woes were magnified by the fact that the Swiss National Bank had kept rates unchanged around their 0.75 percent target since July 2002 while the rest of major central banks—other than the Bank of Japan—had pushed rates higher. As global growth picked up and eq-uity indexes recovered to five-year highs, investors developed higher risk appetites, using low-yielding currencies as funding vehicles.
Japanese Yen: −58 percent
The Japanese yen fell 14 percent in trade-weighted terms, the biggest de-cline on record. The 57 percent cumulative decline against the group of seven currencies was the second biggest in this 1999–2007 period as in-vestors borrowed in ultralow Japanese interest rates to finance higher-yielding investments. Such investments included currencies with higher in-terest rates and those with the greater potential for appreciation without necessarily any substantially high interest rates, such as CAD, whose rates were lower than those for USD, GBP, NZD, and AUD (see Figure 4.14).
0 Response to "2004 Global Recovery Boosts Currencies Against Us Dollar And 2005 Commodities Soar Alongside Dollar, Carry Trades Emerge"
Post a Comment